R² Score: when it works & fails | 3 Tips for CV Summary
Tech skill: Learn how to properly use R2 for regression | Career skill: Get your CV finally converting with writing a killing Summary Section
THE mAIstermind: Issue 2
Reading time - 4 mins
1. Technical ML Section
R-squared regression metric - summary of benefits, pitfalls and guidelines for proper usage. The full article is HERE (reading time - 7 mins).
2. Career ML Section
3 tips to crack Resume summary section
1. Technical ML Section:
(For a deep breakdown, read the full blog post!)
R-squared (or R²) is probably the most famous regression metrics which is widely use in evaluation of regression models.
However, there are several important pitfalls of R-squared which make it a poor performance measure. We’ll discuss them in this newsletter issue.
What is R2?
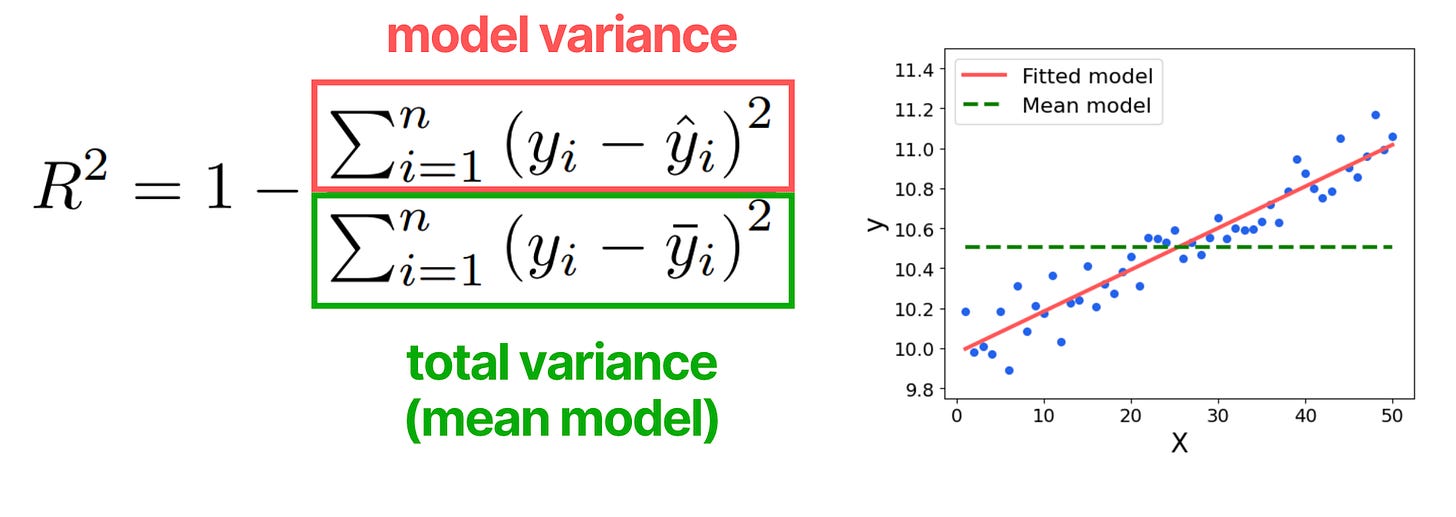
R² estimates how much variance is explained by the fitted model compared to a simple mean model (total variance).
🟢 Good sides R²:
It is scale-independent which helps to compare the models for different datasets or dataset ranges of the same problem.
Good for quick baseline comparison - shows if your model is better than just predicting the mean.
Quick evaluation: If R² is very low (e.g., < 0.2 or negative), the model is likely ineffective.
🔴 Pitfalls of R²:
High R² doesn’t mean a good model – A model can have high R² but still fail to capture the actual data trend, especially for non-linear relationships.
Low R² doesn’t always mean a bad model – If data contains a lot of noise, R² can be low even if the model is optimal.
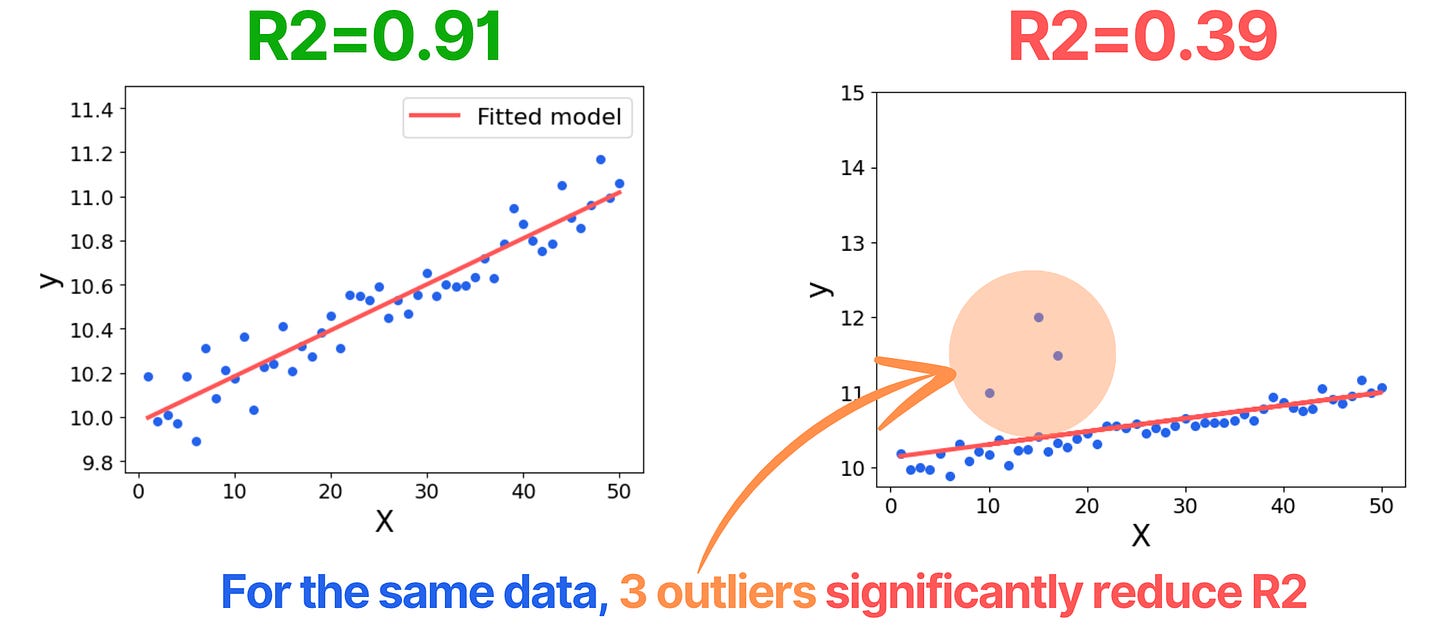
Outlying values greatly effect R².
R² always increases when adding more features – this can artificially increase R², while other metrics (e.g. MAPE) can be negatively affected.
Decision guide
🚫 When NOT to Use R-Squared:
Avoid for non-linear models – A high R² doesn’t mean the model captures non-linear relationships.
Don’t use R² alone – Always combine it with other metrics to get a complete picture of model performance.
R² is unreliable for feature selection – Since R² always increases with more features, it can give a false impression of model improvement.
✅ When R-Squared is Useful
Works well for linear models on near-linear data without outliers.
Quick model performance check – If R² < 0.2 or negative, the model likely performs poorly.
For a deep breakdown, read the full blog post!
2. Career ML Section
3 tips to crack Resume summary section
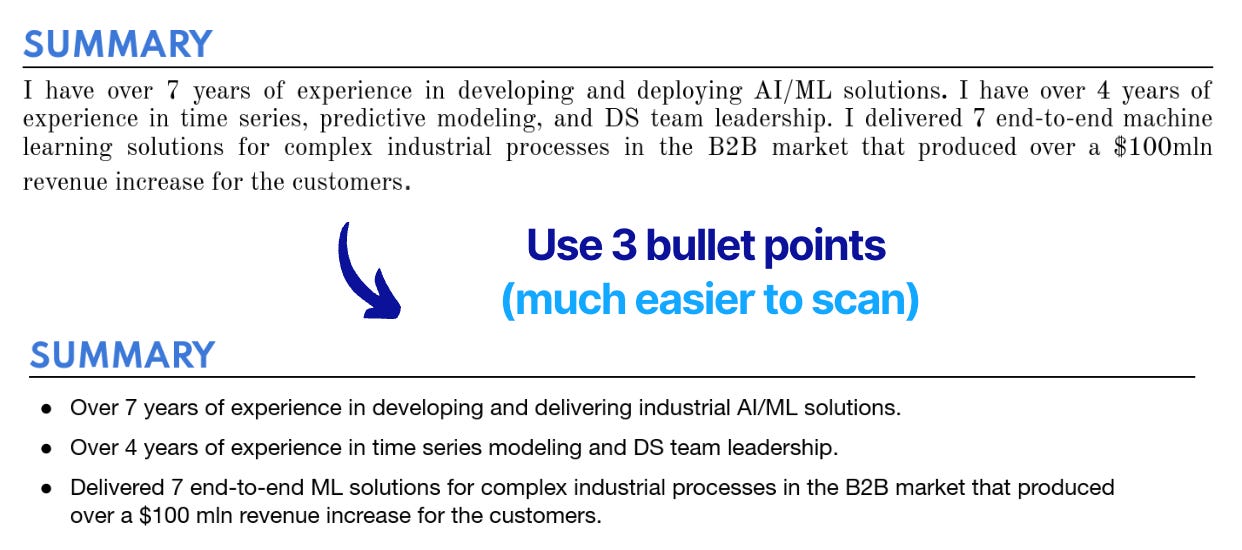
✅ Tip 1: Don’t use plain text in the summary - use bullet points instead.
This makes the section MUCH easier to scan over 3-5 seconds that HR has.
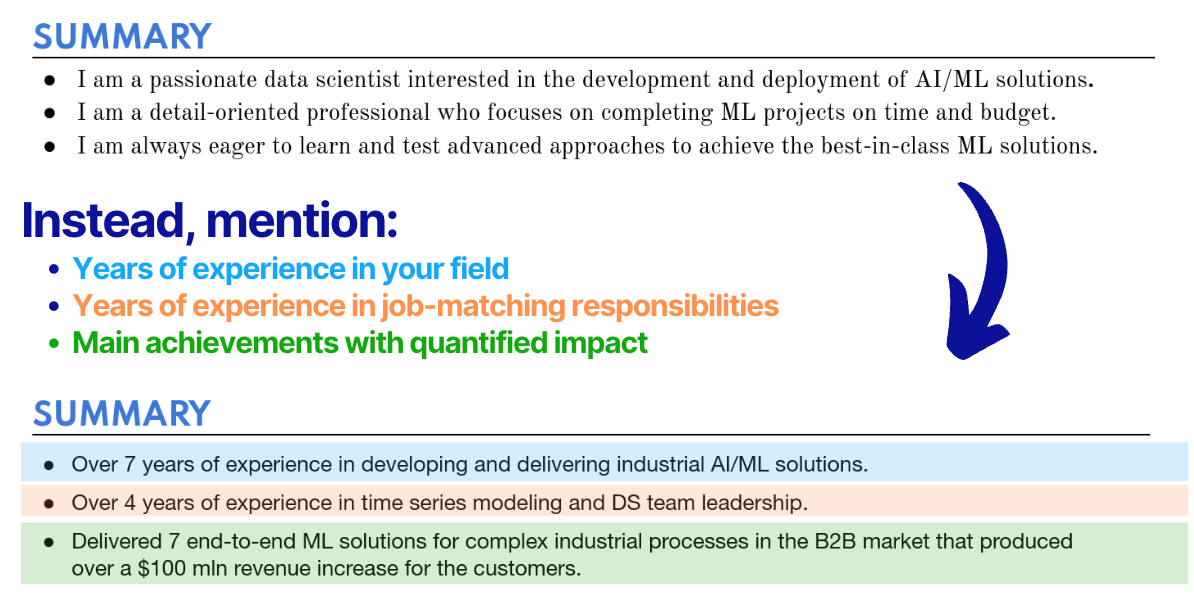
✅ Tip 2: In bullet points, avoid generic info.
✅ Tip 3: Use bold font to highlight the most important words, e.g.:
To quickly apply the tips, you can use my FREE ML Resume Template!
That is it for this week!
If you haven’t yet, follow me on LinkedIn where I share Technical and Career ML content every day!

